Measurement of radiation and radioactivity in Tokyo Port
As a countermeasure against harmful rumors related to the accident at TEPCO's Fukushima Daiichi Nuclear Power Plant, we have decided to monitor the radiation in the atmosphere at each container wharf in Tokyo Port and radioactivity in the seawater in the Port and radiation dose on the surface of containers through cooperation with Tokyo Port Terminal Corporation. The measurement result shall be disclosed on this website.
|
・April 14, 2011 ~ May 8, 2011 |
atmosphere (every Monday and Thursday), seawater(from Monday to Friday) |
|
・May 9, 2011 ~ March 31, 2013 |
atmosphere, seawater, container surface(from Monday to Friday) |
|
・April 1, 2013 ~March 31, 2014 |
atmosphere, seawater, container surface(every Monday and Thursday) |
|
・April 1, 2014 ~March 31, 2017 |
atmosphere, seawater, container surface(every Thursday (or Friday sometimes)) |
|
・April 1, 2017~ |
atmosphere, seawater, container surface(biweekly Thursday) |
* business days only
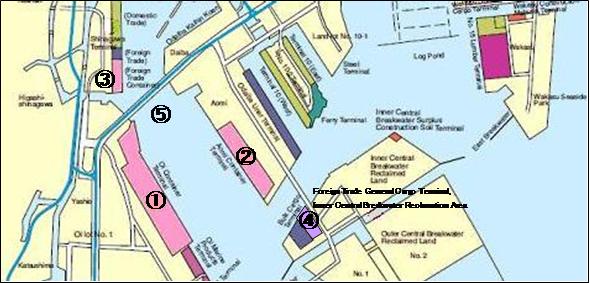
Map of monitoring site
・Amount of radiation in the air is measured with scintillation style survey meter 1.5 meter above ground level (1.0 meter above ground level by May 5, 2011).
Measurement result
1. Radiation in the atmosphere
*Measurement is conducted in the morning in front of central gates in each container piers, and the average of the indicated two extreme values is recorded.
(Unit:μSv/h)
| Area | Oi | Aomi | Shinagawa | Central Breakwater Reclaimed Land | Remarks |
| Jul.4(Thu) | 0.05 | 0.03 | 0.04 | 0.04 | ー |
| Jul.1(Mon) | |||||
| Jun.6(Thu) | 0.05 | 0.04 | 0.05 | 0.04 | ー |
| Jun.3(Mon) | |||||
| May.13(Mon) | |||||
| May.2(Thu) | 0.05 | 0.05 | 0.04 | 0.05 | ー |
| Apr.4(Thu) | 0.05 | 0.05 | 0.04 | 0.05 | ー |
| Apr.1(Mon) | |||||
| Feb.5(Mon) | |||||
| Feb.1(Thu) | 0.05 | 0.04 | 0.05 | 0.04 | ー |
Published data in 2021
Published data in 2020
Published data in 2019
Published data in 2018
Published data in 2017
Published data in 2016
Published data in 2015
Published data in 2014
Published data in 2013
Published data in 2012
Published data in 2011
2. Radioactivity in the seawater (surface)
*Seawater to measure is obtained at the point between Oi Container Wharf and Aomi Container Wharf in the morning.
*"ND" means that the data were blow thedetection limit (not detected).
(Unit:Bq/L)
| Type | Iodine-131 | Caesium-134 | Caesium-137 | Remarks |
| Jul.4(Thu) | ||||
| Jul.1(Mon) | ND | ND | ND | ー |
| Jun.6(Thu) | ||||
| Jun.3(Mon) | ND | ND | ND | ー |
| May.13(Mon) | ND | ND | ND | ー |
| May.2(Thu) | ||||
| Apr.4(Thu) | ||||
| Apr.1(Mon) | ND | ND | ND | ー |
| Feb.5(Mon) | ND | ND | ND | ー |
| Feb.1(Thu) |
Published data in 2021
Published data in 2020
Published data in 2019
Published data in 2018
Published data in 2017
Published data in 2016
Published data in 2015
Published data in 2014
Published data in 2013
Published data in 2012
Published data in 2011
3.Radiation at container surfaces
*Measure radiation dose on the surface of each sample container at the gate of pier head, and disclose number of samples, maximum volume, minimum volume, average volume by pier.
(Unit: pcs,μSv/h)
| Area | Oi | Aomi | Shinagawa | Central Breakwater Reclaimed Land | |
| Jul.4(Thu) | samples | 23 | 6 | 1 | 13 |
| maximum | 0.04 | 0.04 | 0.02 | 0.03 | |
| minimum | 0.01 | 0.01 | 0.01 | 0.01 | |
| average | 0.03 | 0.02 | 0.02 | 0.02 | |
| decontaminated | 0 | 0 | 0 | 0 | |
| Jul.1(Mon) | samples | ||||
| maximum | |||||
| minimum | |||||
| average | |||||
| decontaminated | |||||
| Jun.6(Thu) | samples | 27 | 7 | 5 | 14 |
| maximum | 0.04 | 0.03 | 0.02 | 0.03 | |
| minimum | 0.01 | 0.02 | 0.01 | 0.01 | |
| average | 0.02 | 0.02 | 0.02 | 0.02 | |
| decontaminated | 0 | 0 | 0 | 0 | |
| Jun.3(Mon) | samples | ||||
| maximum | |||||
| minimum | |||||
| average | |||||
| decontaminated | |||||
| May.13(Mon) | samples | ||||
| maximum | |||||
| minimum | |||||
| average | |||||
| decontaminated | |||||
| May.2(Thu) | samples | 24 | 12 | 0 | 16 |
| maximum | 0.04 | 0.04 | ー | 0.03 | |
| minimum | 0.01 | 0.01 | ー | 0.01 | |
| average | 0.02 | 0.02 | ー | 0.02 | |
| decontaminated | 0 | 0 | ー | 0 | |
| Apr.4(Thu) | samples | 26 | 8 | 4 | 14 |
| maximum | 0.04 | 0.04 | 0.02 | 0.03 | |
| minimum | 0.01 | 0.01 | 0.01 | 0.02 | |
| average | 0.03 | 0.02 | 0.02 | 0.02 | |
| decontaminated | 0 | 0 | 0 | 0 | |
| Apr.1(Mon) | samples | ||||
| maximum | |||||
| minimum | |||||
| average | |||||
| decontaminated | |||||
| Feb.5(Mon) | samples | ||||
| maximum | |||||
| minimum | |||||
| average | |||||
| decontaminated | |||||
| Feb.1(Thu) | samples | 27 | 13 | 1 | 9 |
| maximum | 0.04 | 0.04 | 0.03 | 0.03 | |
| minimum | 0.01 | 0.01 | 0.02 | 0.02 | |
| average | 0.03 | 0.02 | 0.03 | 0.02 | |
| decontaminated | 0 | 0 | 0 | 0 | |
Published data in 2021
Published data in 2020
Published data in 2019
Published data in 2018
Published data in 2017
Published data in 2016
Published data in 2015
Published data in 2014
Published data in 2013
Published data in 2012
Published data in 2011
For inquiries about our business,
please contact us through the
following:
Bureau of Port and Harbor,Tokyo Metropolitan Government
EMail:kouwan_kouhou@section.metro.tokyo.jp
8-1 Nishishinjuku 2-chome Shinjuku-ku Tokyo 163-8001, Japan